Chapter 4 Question 1
Question:
What are the time-series properties of the spot rates \(y_t(1)\), \(y_t(5)\), and \(y_t(10)\)? Report their summary statistics, including mean, standard deviation, skewness, kurtosis, and the first four autocorrelation coefficients, and the correlation matrix of the spot rates. Comment on your results. Also plot them and comment on the time series patterns.
In this question, data for the \(y_t(1)\), \(y_t(5)\), and \(y_t(10)\) spot rates is required. This has been calculated in Section 3.1, and the results from there are used here.
4.1 Summary Statistics
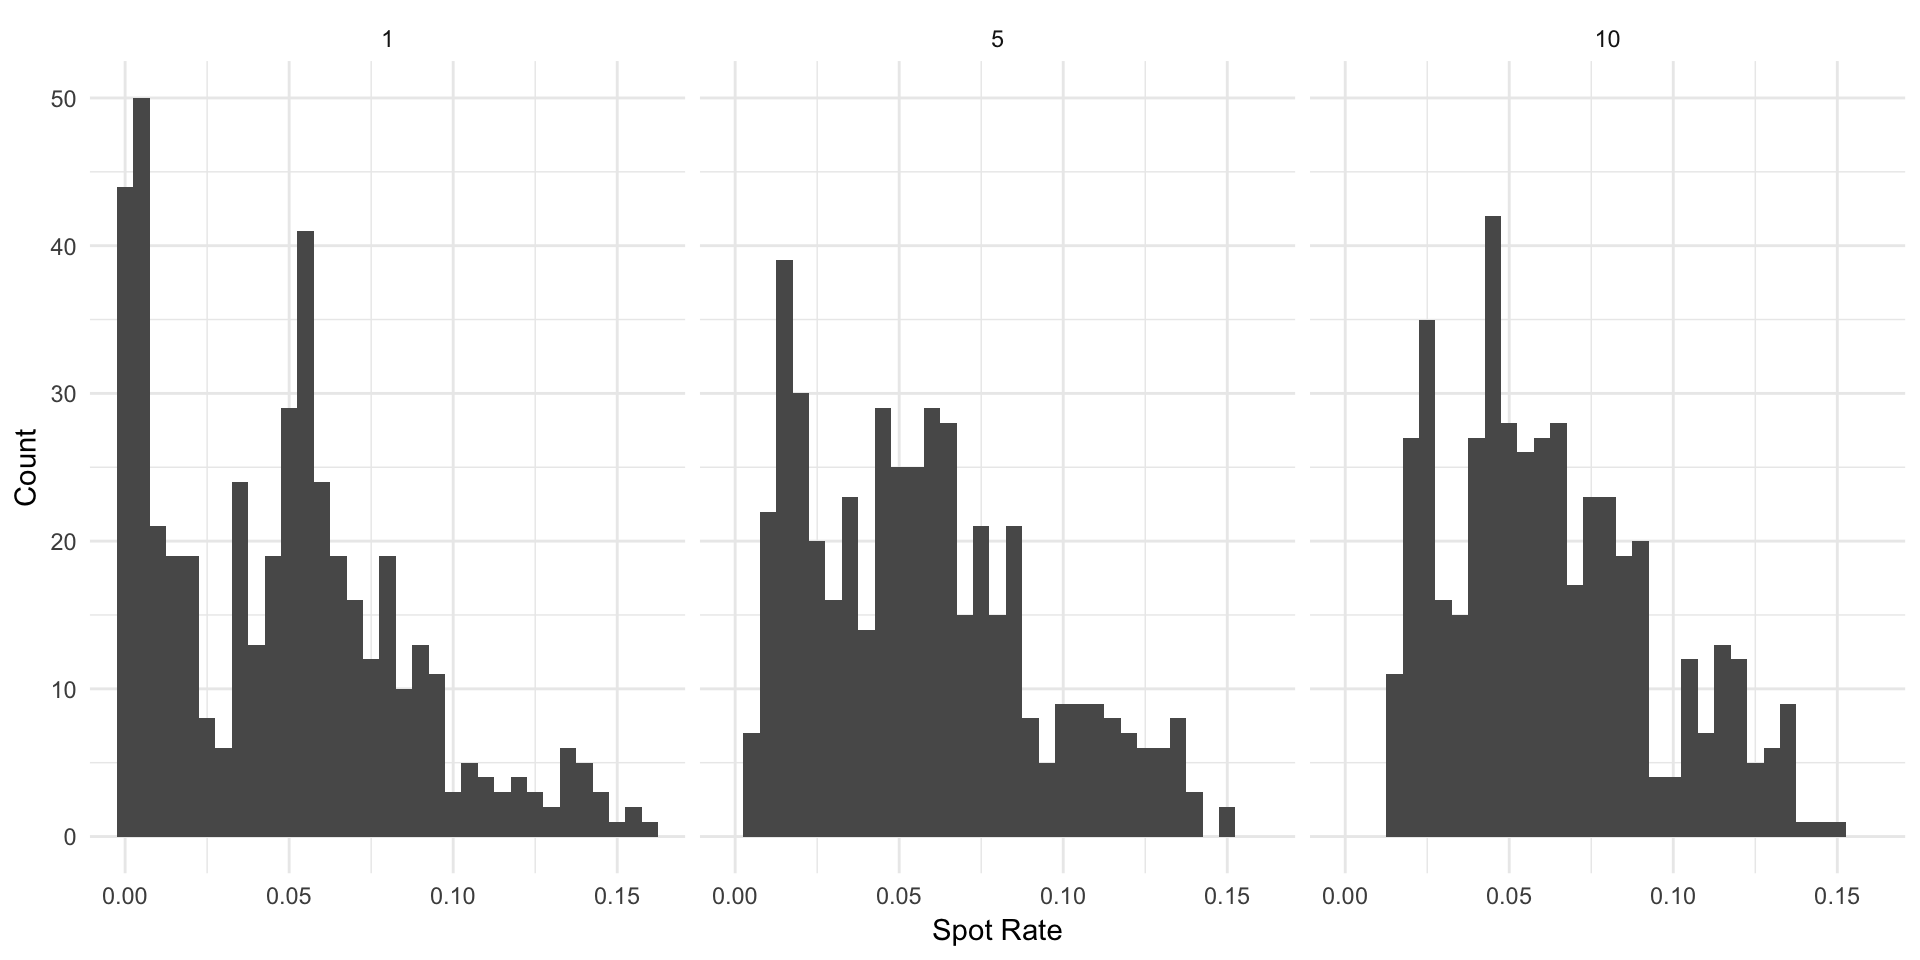
Reported in Table 4.1 are summary statistics on the three spot rate series. Unsurprisingly, the average spot rate increases with the maturity, but interestingly, the shorter maturity spot rates have higher volatility. The kurtosis of all three are less than that of a normal distribution, but the 1-year maturity is very close. All three are right-skewed, with longer right tails, which makes sense considering extremely high interest rate periods do happen, but are rare. The histograms in Figure 4.1 are a nice visual confirmation of the results in the table. The skewness is clear, and the higher standard deviation for lower maturities might be attributed to the higher density at the extreme tails.
| Maturity | Mean | Standard Deviation | Kurtosis | Skewness |
|---|---|---|---|---|
| 1 | 0.0480538 | 0.0375029 | 2.913858 | 0.6505396 |
| 5 | 0.0566592 | 0.0345430 | 2.567191 | 0.5659543 |
| 10 | 0.0627654 | 0.0314939 | 2.586681 | 0.5793584 |

Figure 4.1: Spot rate distributions
4.2 Autocorrelations
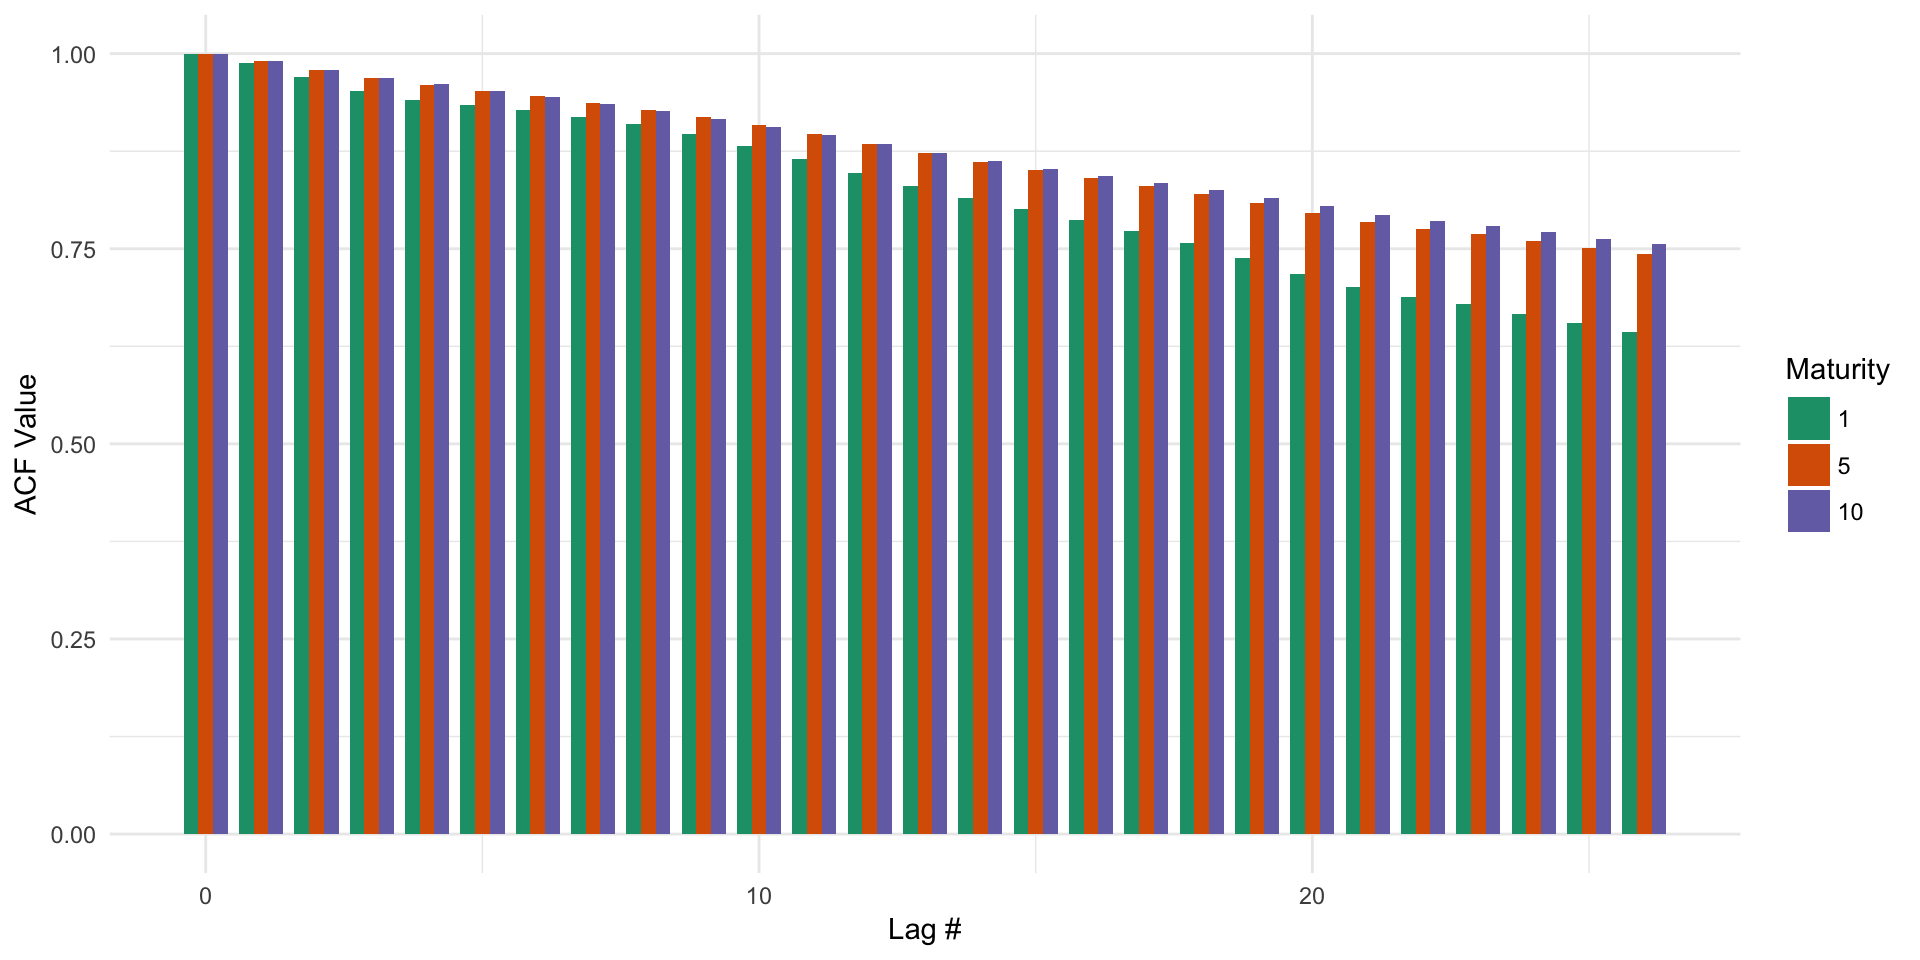
The first four autocorrelation coefficients of the 3 series are reported in Table 4.2, along with a plot of the ACF for the entire series in Figure 4.2. Each of the series are highly autocorrelated, with autocorrelation above 0.6 out past the 25th lag. By looking at the entire ACF, one can note that the amount of and persistance of autocorrelation increases in maturity.
| Maturity | Lag 1 | Lag 2 | Lag 3 | Lag 4 |
|---|---|---|---|---|
| 1 | 0.9878979 | 0.9697433 | 0.9527499 | 0.9411647 |
| 5 | 0.9911143 | 0.9791933 | 0.9686252 | 0.9599084 |
| 10 | 0.9906205 | 0.9793246 | 0.9691974 | 0.9606667 |

Figure 4.2: ACF for the 1, 5, and 10 year spot rates
4.3 Correlations
Correlations between the 1, 5, and 10 year spot rates are reported in Table 4.3. It is clear that the the series are highly correlated. This should not be surprising whatsoever. Intuitively, the 1 year is more correlated with the 5 year than with the 10 year, but the overall correlations are so high that this likely has no significant meaning.
| Maturity | 1 | 5 | 10 |
|---|---|---|---|
| 1 | 1.0000000 | 0.9783620 | 0.9539364 |
| 5 | 0.9783620 | 1.0000000 | 0.9932312 |
| 10 | 0.9539364 | 0.9932312 | 1.0000000 |
4.4 Time Series Visualizations
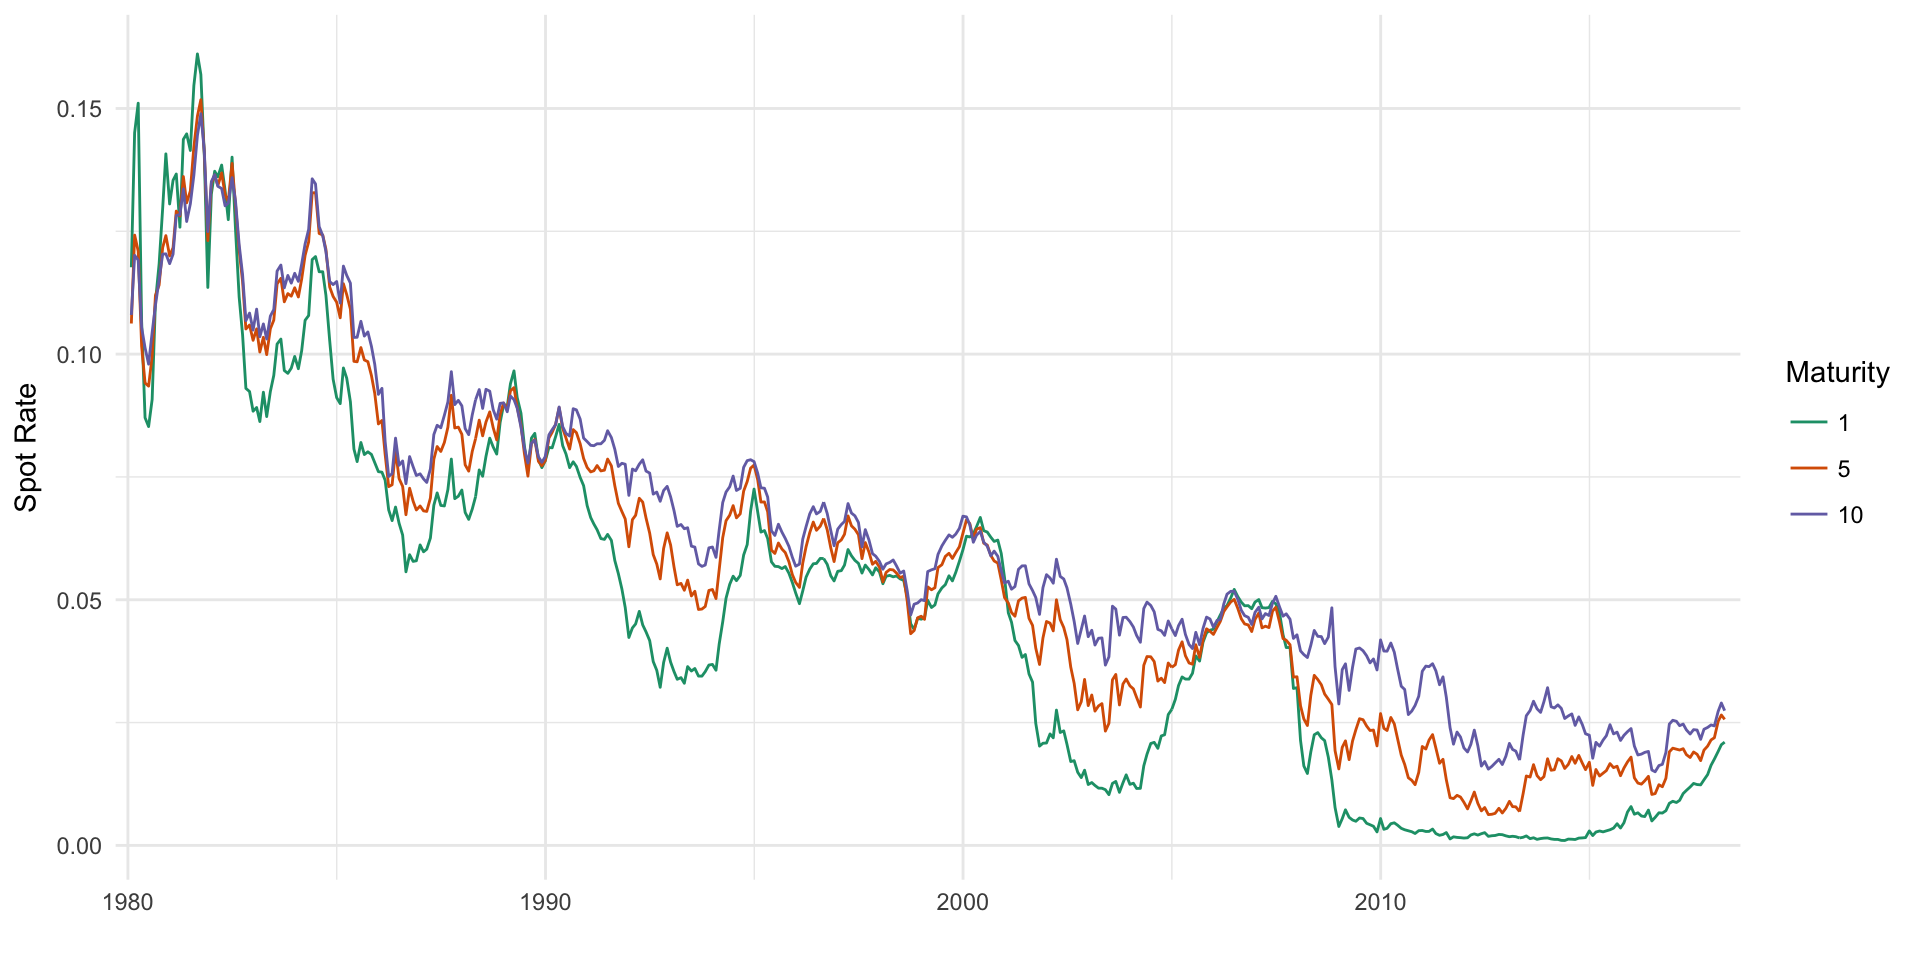
A look at the time series of the three series confirms the highly autocorrelated and correlated nature of the three series. 1 year spot rates are almost always below the longer maturity rates, as one would expect. Since 2010, 1 year spot rates have been incredibly low, but have started to pick back up in the last few years.

Figure 4.3: A look at the 1, 5, and 10 year spot rates over time